BBT charting can be used to detect ovulation and see if you are pregnant or not in early pregnancy. Pretty cool!
Here, we go through how to use BBT charting for different purposes, and you can print out a BBT chart in either Celcius or Fahrenheit if you want to do your charting on paper.
Are you considering basal body temperature charting (BBT charting) but want to learn how it works or for what purposes?
Charting basal body temperature (BBT) is done by measuring your BBT every day at the same time of the day before getting out of bed and documenting your findings. You create a chart that shows your temperature over the entire cycle.
Why would anyone do that?
Many women do this to predict their ovulation to get pregnant faster.
This can certainly be done. To be used effectively for ovulation prediction, it needs to be combined with looking for other symptoms of ovulation! (Learn more about ovulation symptoms here.)
In addition to predicting ovulation, BBT charting can actually also be used for predicting pregnancy very early! Very exciting and very addictive. I used BBT charting for some 18 months when trying to conceive. I predicted both of my successful pregnancies and one miscarriage with this method before any pregnancy test would detect the conception.
But why not use it as the only method for ovulation prediction? Hang on, I’ll explain it all below, AND you can download your very own printable BBT chart at the bottom of this article too. :-)
All About Charting Basal Body Temperature
- BBT Charting For Ovulation Prediction
- BBT Charting For Pregnancy and Conception Prediction
- How To Use BBT Charting
- BBT Charting On A Shoe String
- How To Take The Temperature Correctly
- Complimentary Printable BBT charts in Celcius and Fahrenheit
- BBT Charting Video
- Fertility Book Tips
BBT Charting For Ovulation Prediction
When you ovulate, your body temperature rises. This is why you can use BBT charting to detect your ovulation. However, your temperature rises at ovulation or just after afterward.
If you want to maximize your chances of getting pregnant, you should, however, have intercourse just before ovulation. So when the BBT chart shows a temperature rise, your best chances to conceive have already passed. This means that if you want to use BBT to track your ovulation, at least combine it with other methods to detect your ovulation symptoms.
BBT Charting For Pregnancy and Conception Prediction
At or just after ovulation, your body temperature rises due to an increase in the hormone progesterone in your body. At menstruation, your body temperature falls down to normal levels.
So, if you continue to measure your temperature every day (after ovulation as well), you will find clues as to whether you have conceived or not. You are not likely to be pregnant if you usually have 14 days between ovulation and menstruation, and your BBT starts to fall at around day 11 after ovulation.
But here is the exciting part: If your body temperature remains high despite approaching the first day of menstruation, you might be pregnant. And what is even more exciting is if your temperature starts to rise some more at around day 10 after ovulation, a so-called triphasic temperature pattern, you are highly likely to be pregnant!
At around 10 days after ovulation, implantation of the fertilized egg into the uterus lining occurs. At this time, some women, but not all, will experience slight pain and/or bleeding called implantation bleeding. But even if you don’t, you may still be able to notice a temperature increase at the time of implantation. If the temperature increase continues or at least remains high, the BBT charting will predict your pregnancy several days before the pregnancy test.
In the video below, you can see an example of a successful pregnancy, which could be detected before the due date, due to a second temperature increase at implantation.
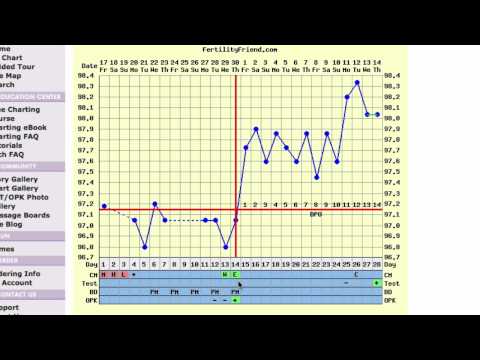
Also, take a look at the image below. You’ll see the normal BBT rise in connection with ovulation. However, there is no additional temperature increase around 10 days after ovulation, but rather a slow decrease towards normal non-pregnant temperatures. (There is a small increase, but not above ovulation BBT). If the chart was to show a pregnant woman, the temperature would have remained high and possibly even increased further after some 10 days.

Note: Even if you do not get the second temperature rise, you may still be pregnant. But if your temperature starts to fall as you approach the end of your menstrual cycle, you are not likely to have conceived.
How To Use BBT Charting
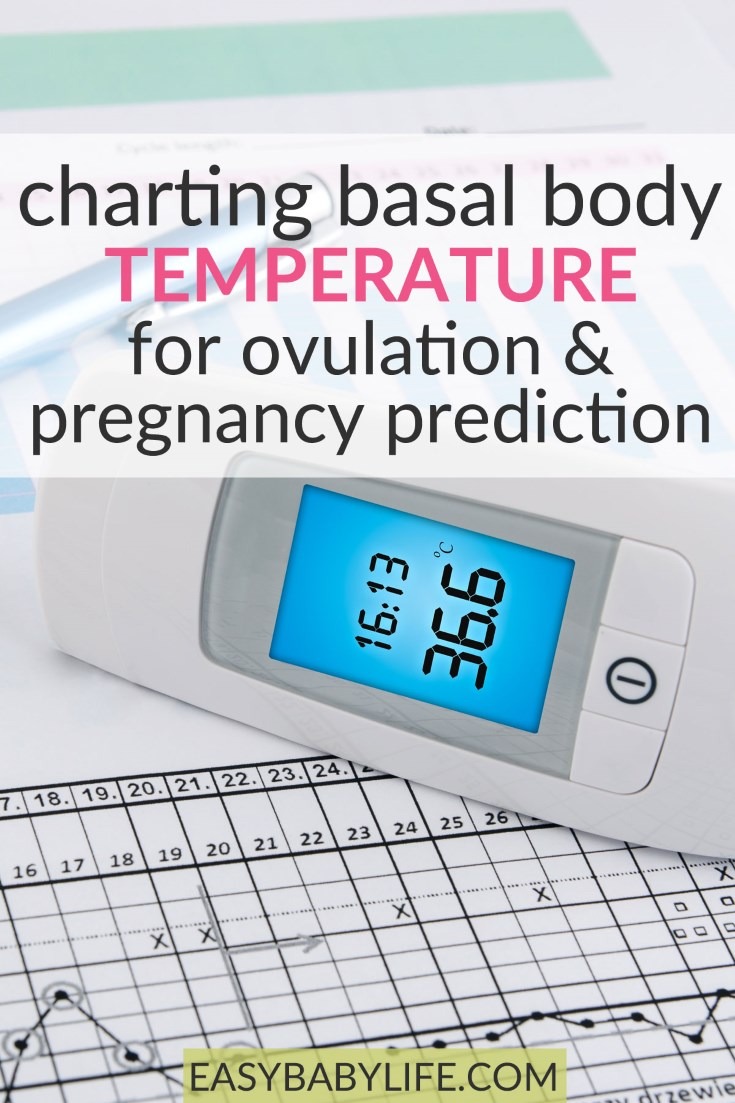
If you want to get serious with BBT charting, you may want to get yourself a BBT thermometer and a BBT charting sheet.
BBT thermometers are different compared to the usual oral thermometers because they are more sensitive. When checking for fever, you don’t need a very sensitive thermometer. Still, for BBT charting, it is better to have one that measures even small temperature variations correctly.
The difference between your regular body temperature and your temperature after ovulation will only be 0.4 – 1 degree (Celsius or Fahrenheit). The normal thermometers used for measuring fever temperatures usually have markings of 0.20F or 0.10C. For preparing a basal body temperature chart, a basal thermometer with an accuracy of 0.10F or 0.050C is useful (although not entirely necessary – I’ll get to that below).
You’ll also need some sort of chart to fill in your data. The easiest way is to use the printable chart available here for download . Mark the temperature daily and fill in all other data you want. The chart will likely give you a lot of information about your cycle after using it for a couple of months.
If you don’t want anyone to know what you are up to, you can simply write down your data from charting basal body temperature on a piece of paper or in an empty Excel sheet. Simply write down the day of your cycle and the temperature beneath it daily. You then mark the day of ovulation and the day of menstruation. After a few cycles, you can easily detect the temperature rise following ovulation. (And hopefully, the additional rise due to your implantation bleeding.)
You can also simply search for “BBT Charting apps” on your mobile phone. There are several of them, and some of the more advanced resources will provide you with checkboxes and room to describe your mood, cervical mucus, hormones, and other signs of ovulation and/or pregnancy, while other resources are simpler. It is all up to you how serious you want to be.
BBT Charting On A Shoe String
If you don’t want to get yourself a BBT thermometer or other resources, BBT charting can be done with a regular thermometer and a piece of paper or an Excel sheet. I did it this way.
Personally, I just used an Excel sheet where I wrote the day of the menstrual cycle, plugged into the temperature each day, and also wrote comments on ovulation day and other signs of ovulation and pregnancy. Easy! But this was a couple of years ago, so there weren’t as many free resources around at that time.
I just used a regular oral thermometer and this Excel sheet, and I was still able to detect all my three pregnancies before my period was due. Nevertheless, a BBT thermometer is likely to give you more accurate results.
How To Take The Temperature Correctly
If you are anything at all as I was when I wanted so badly to get pregnant, you may end up taking your temperature 5 times per day… Don’t.
Only the morning temperature before getting out of bed (or at least before doing anything but going slowly to the bathroom) will tell you anything about your cycle. As soon as you start walking around or doing anything but lying down, your body temperature rises, and you will not get reliable data anymore.
So to use BBT charting, you need to take your temperature in the same way, more or less at the same time every morning before getting out of bed. Basal body temperature varies with time, but it is okay if the average time stays within thirty minutes on either side.
Not too difficult, right?
Maybe too easy, actually, because I found it very addictive for pregnancy prediction!
Complimentary Printable BBT charts in Celcius and Fahrenheit
To download your BBT chart, right-click on the link and choose “save link as”.
Download your chart in Celsius here!
or
Download your chart in Fahrenheit here!
I hope you will find it useful!
BBT Charting Video
Watch this video to learn more about using and understanding your fertility chart and charting basal body temperature.
Fertility Book Tips
If you want to find more information about your fertility, ovulation symptoms, charting basal body temperature, and how to get pregnant, check out any of these books.
- Taking Charge of Your Fertility, 20th Anniversary Edition: The Definitive Guide to Natural Birth Control, Pregnancy Achievement, and Reproductive Health
- Be Fruitful: The Essential Guide to Maximizing Fertility and Giving Birth to a Healthy Child
- It Starts with the Egg: How the Science of Egg Quality Can Help You Get Pregnant Naturally, Prevent Miscarriage, and Improve Your Odds in IVF
Are you charting basal body temperature? Please share your experiences in the comments section below!
Read Next
- Tips For Getting Pregnant
- The Odds Of Getting Pregnant
- First Signs Of Being Pregnant
- Want To Conceive a Boy? Go Bananas!
- Getting Pregnant After Miscarriage
- Getting Pregnant During The Menstrual Period – Possible?

Paula Dennholt founded Easy Baby Life in 2006 and has been a passionate parenting and pregnancy writer since then. Her parenting approach and writing are based on studies in cognitive-behavioral models and therapy for children and her experience as a mother and stepmother. Life as a parent has convinced her of how crucial it is to put relationships before rules. She strongly believes in positive parenting and a science-based approach.
Paula cooperates with a team of pediatricians who assist in reviewing and writing articles.